Environmental Performance report
Hisdesat is committed to the environment and has implemented an environmental management system that aligns with the ISO 14001 standard. With the aim of protecting the world around us and preventing pollution, the environmental management system is periodically reviewed and assessed to identify actions that can be taken to minimize the negative impact of our business activity on our surroundings.
Indicators
Based on the environmental aspects defined by Hisdesat, a series of indicators have been established, all of which have behaved as expected.
Below, we are providing a summary of Hisdesat’s environmental performance in 2022 based on our annual monitoring of each of the indicators, as well as a comparison with previous years.
Electricity consumption per m2 of office space remained at the same level as the previous year. Electricity consumption has returned to normal and is also comparable to the consumption levels logged in the years prior to the COVID-19 pandemic. Below is a graph that shows monthly electricity consumption since 2017.
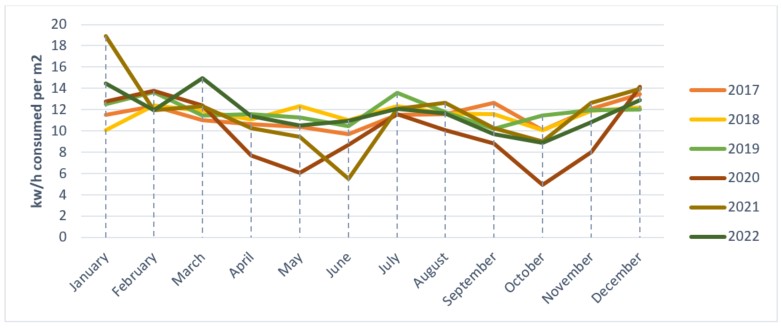
Both 2020 and 2021 were two years of peaks. This is due to the instability of the presence of staff at the office. Compared to 2021, electricity consumption in 2022 has remained more stable. If we compare it with the last year of normal activity (2019) or even with years before that, the general consumption of 2022 was quite similar.
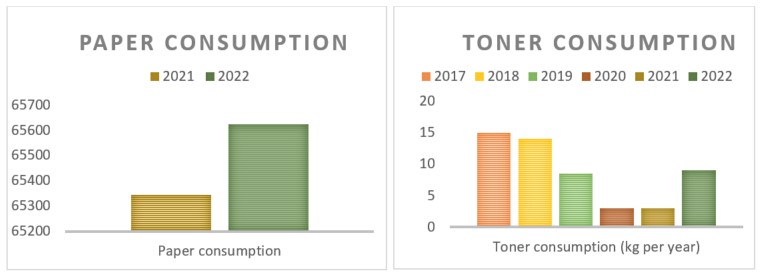
For the rest of the consumption types analyzed by the company, a summary table has also been prepared that compares the results obtained during 2022 with the five previous years. In the case of paper consumption, beginning in 2021 this indicator was measured by number of copies – not being comparable, therefore, with the measurements taken in years prior.
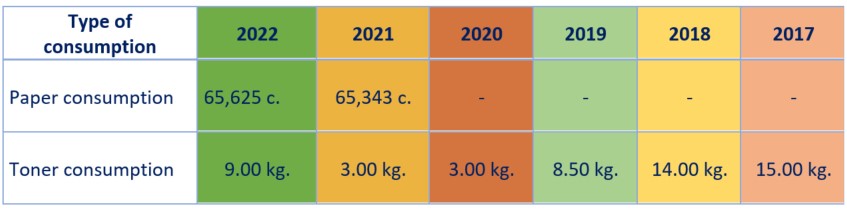
In terms of the consumption types analyzed, consumption of paper remained similar to the previous year, with a small, insignificant increase. The consumption of toner increased considerably due to the fact that it was necessary to replace all the toners one year after the acquisition of new printers – and this was added to full staff incorporation at the office for face-to-face work. All of this data is shown below in a graph displaying the evolution of each item in a more visual way:
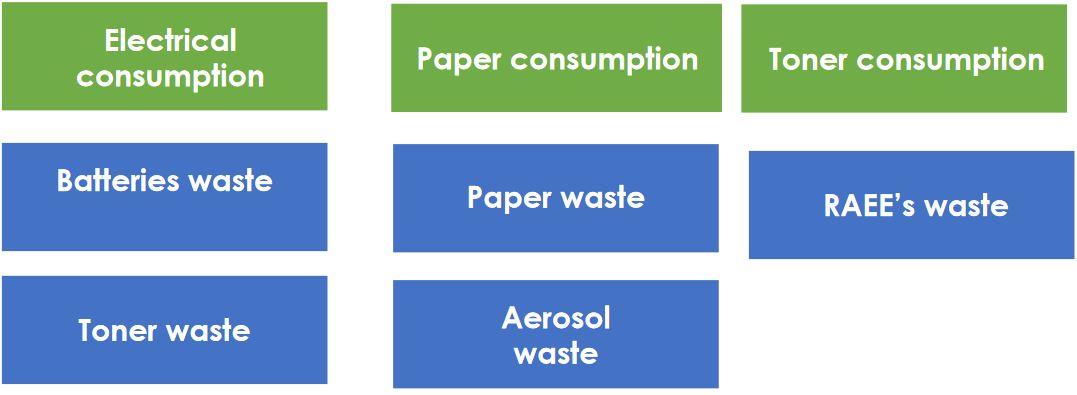
As indicators, the company also analyzes the amount of waste generated and sent to an authorized entity for recycling. The types of waste that are sent for recycling, as well as the amounts generated since 2017, are presented in the following table:
On the other hand, the company analyzes as indicators the amounts of waste that are generated and that are sent for recycling through a company authorized to do so. The types of waste that are sent for recycling, as well as the quantities generated since 2017, are presented in the following table:
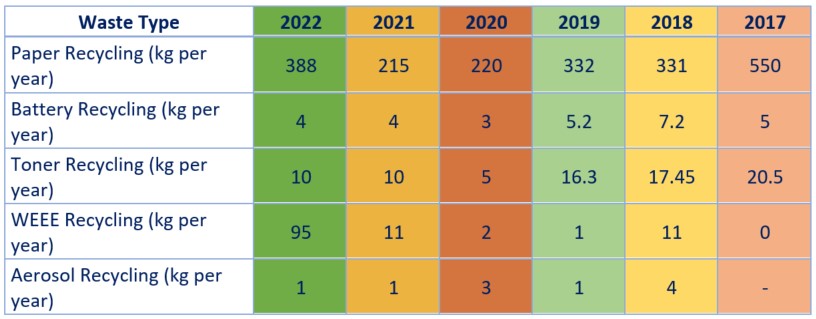
As we can see in the table, the amount of waste generated throughout the year 2022 has remained quite stable, and this is true even when compared to previous years. The reasons for the increases detected in paper recycling and WEEE recycling have been identified and their causes have been analyzed. Upon analysis, the variations detected did not cause any kind of alarm.
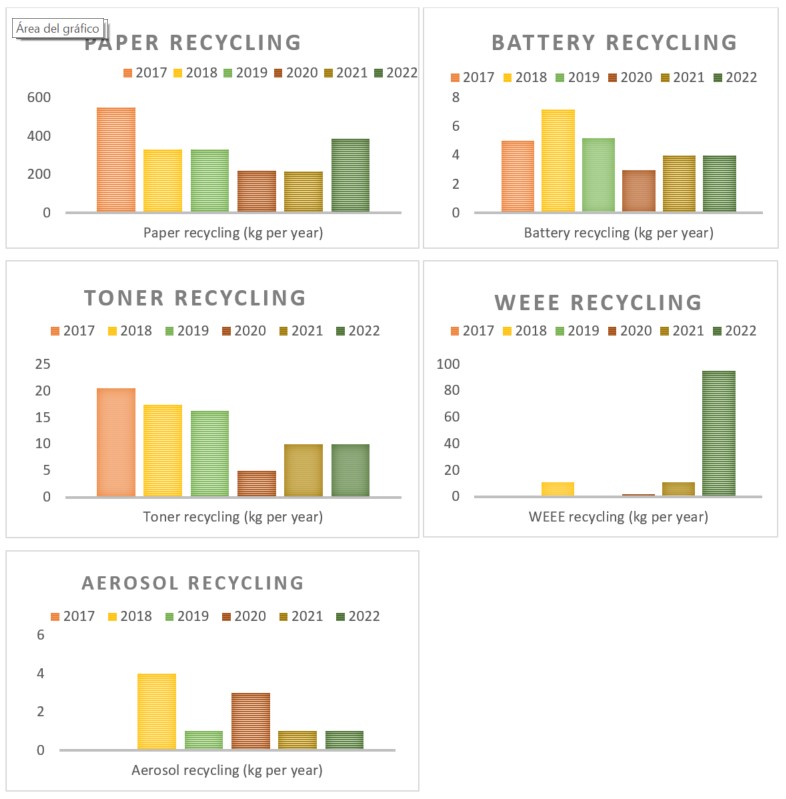
Below, we graphically show the volumes of recycled waste in comparison with previous years:
Drafted in March 2023.