
Page 59 - hisdeSAT annual report 2013
P. 59
59
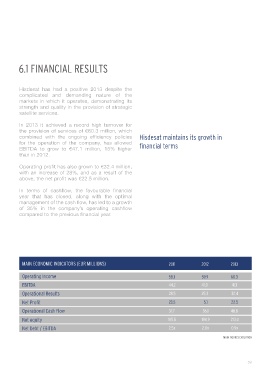
MAIN FIGURES EVOLUTION
2.0x
Net Debt / EBITDA
2.5x
0.9x
190.9
Net equity
185.5
213.0
37.7
48.8
36.1
Operational Cash Flow
Net Profit
5.1
23.5
22.5
28.5
Operational Results
32.4
25.3
47.1
EBITDA
41.0
44.2
59.9
58.1
60.3
Operating Income
2013
2011
2012
MAIN ECONOMIC INDICATORS (EUR MILLIONS)
compared to the previous financial year.
of 35% in the company’s operating cashflow
management of the cash flow, has led to a growth
year that has closed, along with the optimal
In terms of cashflow, the favourable financial
above, the net profit was €22.5 million.
with an increase of 28%, and as a result of the
Operating profit has also grown to €32.4 million,
than in 2012.
EBITDA to grow to €47.1 million, 15% higher
financial terms
for the operation of the company, has allowed
combined with the ongoing efficiency policies
Hisdesat maintains its growth in
the provision of services of €60.3 million, which
In 2013 it achieved a record high turnover for
satellite services.
strength and quality in the provision of strategic
markets in which it operates, demonstrating its
complicated and demanding nature of the
Hisdesat has had a positive 2013 despite the
6.1 FINANCIAL RESULTS